03
provincies 2005
recette bezoek
bioscopen doeken (1.000 (1.000)
inwoners
(1.000)
bezoek
per inw.
zuid-holland
36
120
32.565
4.807
24,1%
3.458
1,4
noord-holland
47
129
31.261
4.452
23,1%
2.599
1,7
noord-brabant
34
88
15.603
2.461
11,5%
2.411
1,0
gelderland
37
90
12.556
2.034
9,3%
1.972
1,0
utrecht
19
48
11.036
1.698
8,2%
1.171
1,4
Limburg
16
55
7.795
1.314
5,8%
1.137
1,2
Overijssel
17
45
7.692
1.193
5,7%
1.101
1,1
groningen
8
26
5.526
878
4,1%
575
1,5
friesland
9
29
3.563
563
2,6%
643
0,9
flevoland
5
20
2.889
445
2,1%
366
1,2
zeeland
6
17
2.532
418
1,9%
380
1,1
drenthe
8
26
2.203
354
1,6%
483
0,7
ontbrekend
26
16
totaal nederland
242
693
135.248
20.632
100%
16.298
1,3
Bron: CBS
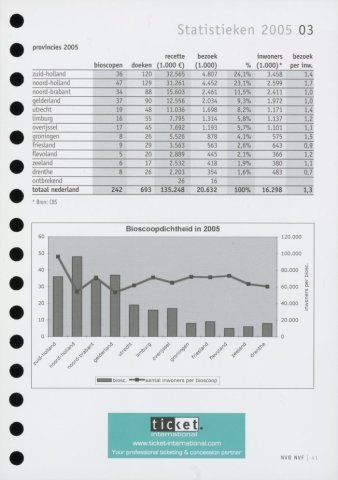
Bioscoopdichtheid in 2005
120.000
100.000
80.000 s
60.000
40.000
20.000
o6 <*- *?-
f
nternational
www.ticket-international.com
Your professional ticketing concession partner
V? J> ^>- CjT X? <2>N „s*"
Ibiosc.
■aantal inwoners per bioscoop
NVB NVF